Boost Conversion Rates for an E-Commerce Business
Date
Dec 2023 - Present
My Role
User Research /
UX Design / Visual Design / Photograph
Team
Emma (UX Designer),
Zoey(UX Designer),
Cassie (CEO),
Dary(Marketing lead)
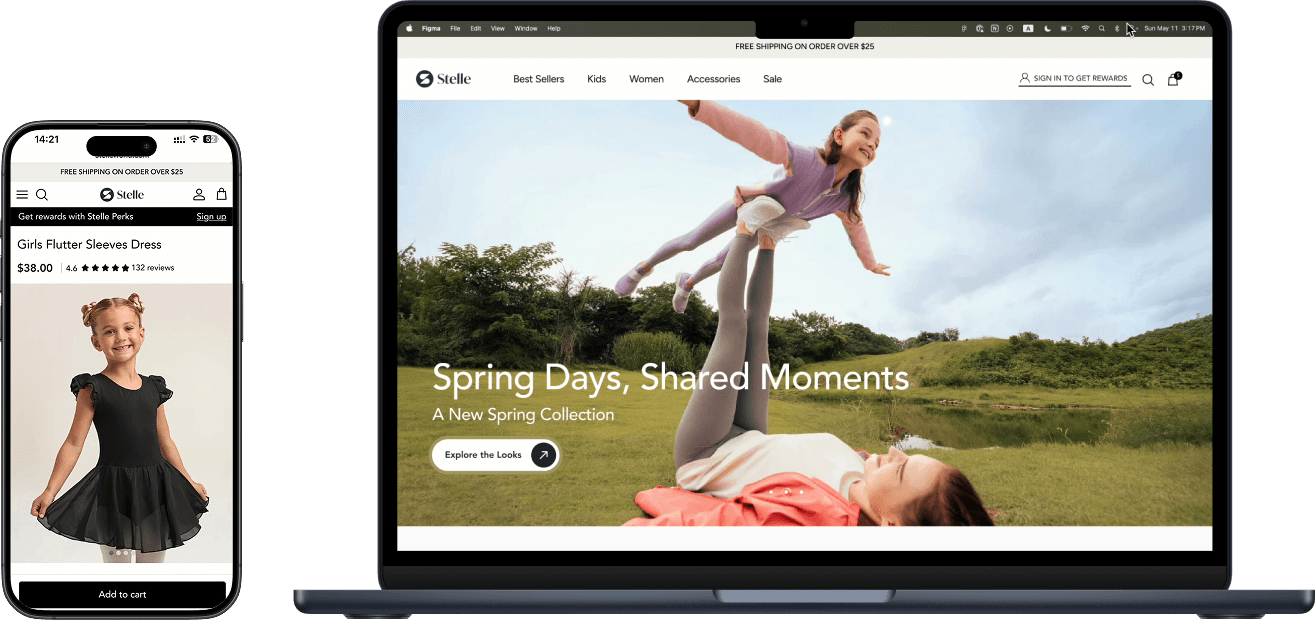
Old website (designed by exteral design agency)
In Q1 2024, we launched the initial version of the site designed by design agency with some basic adjustments, while also implementing extensive user research and integrating various analytics tools to better understand user behavior and inform future improvements.
User Research & Data-Driven Evaluation
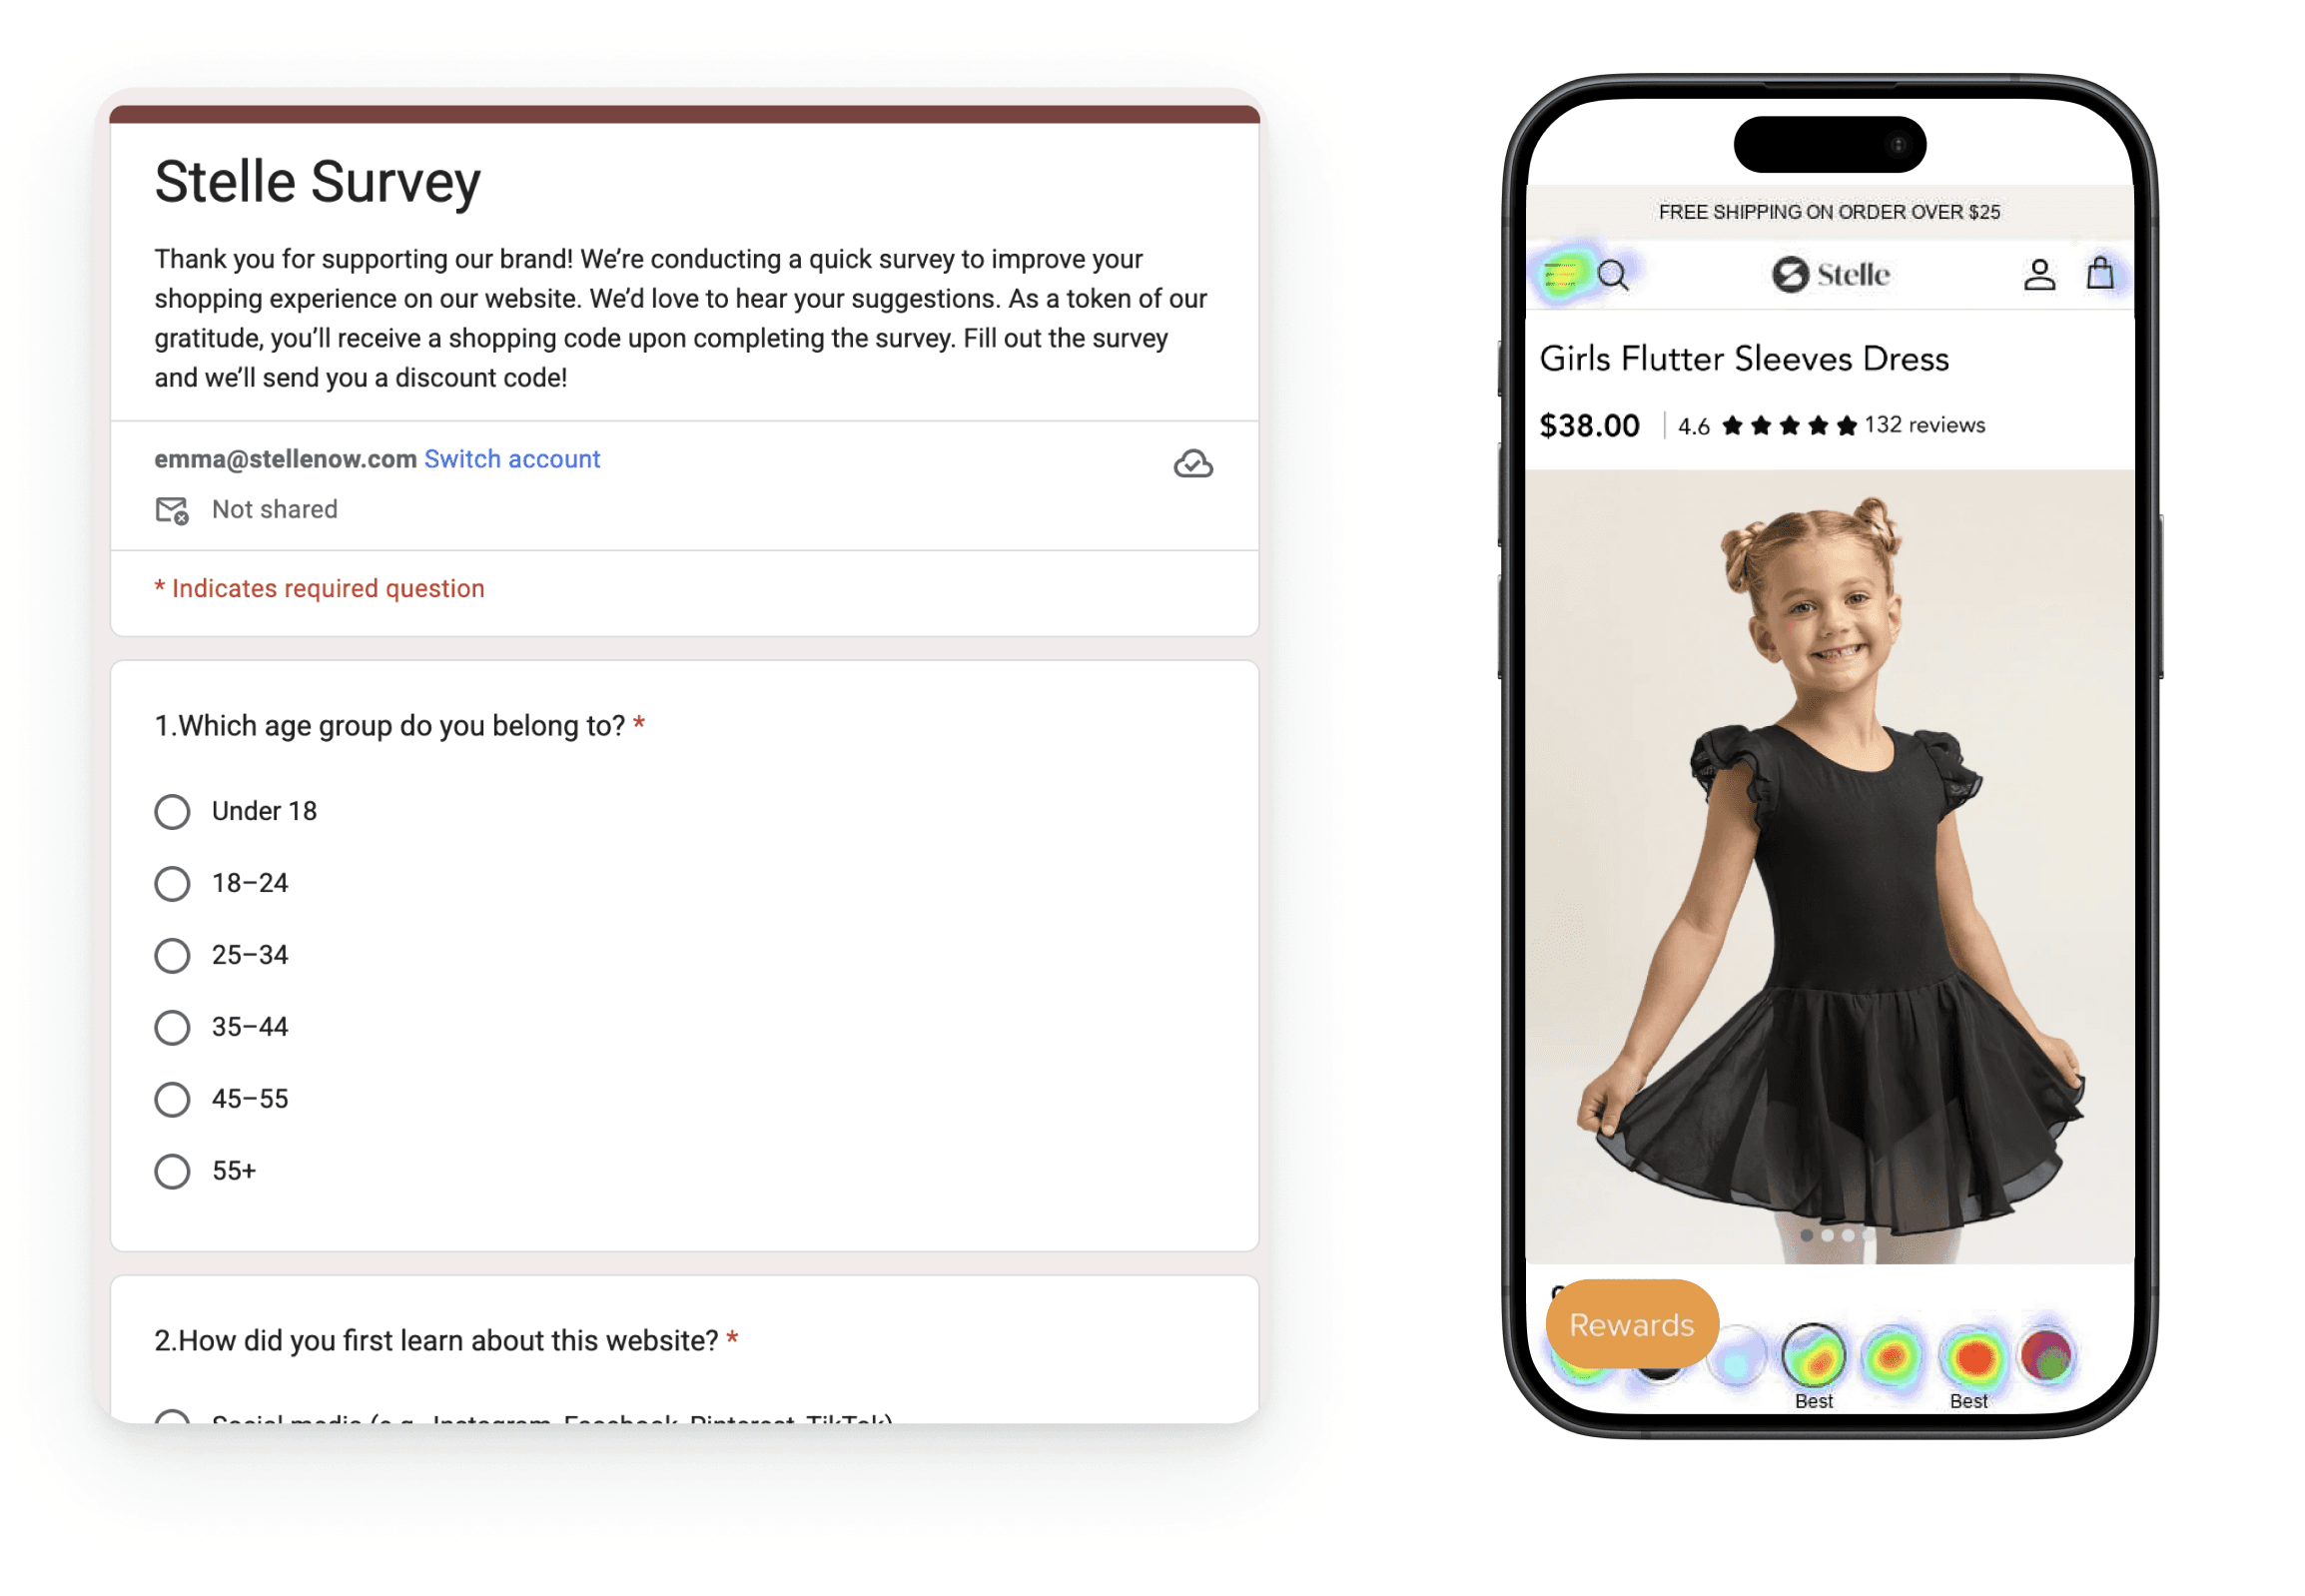
One of the biggest challenges we faced was the lack of a structured framework to evaluate design decisions. Feedback was often based on personal perspectives rather than data-driven insights, making it difficult to align the team and ensure our designs truly met user needs.
To address this, I talked with many users and implemented Google Analysis & Hotjar, two powerful tools that allowed us to track user behavior.
2024 Q2:
Mobile optimization
In 2024 Q2, I identified critical data quality issues and successfully removed bot traffic from our website analytics, revealing that previous metrics had been significantly skewed. Following this data cleansing, I conducted a thorough reanalysis of genuine user behavior patterns.
Based on these accurate insights, I implemented targeted mobile experience optimizations while simultaneously enhancing our brand aesthetics and overall visual consistency across the platform.
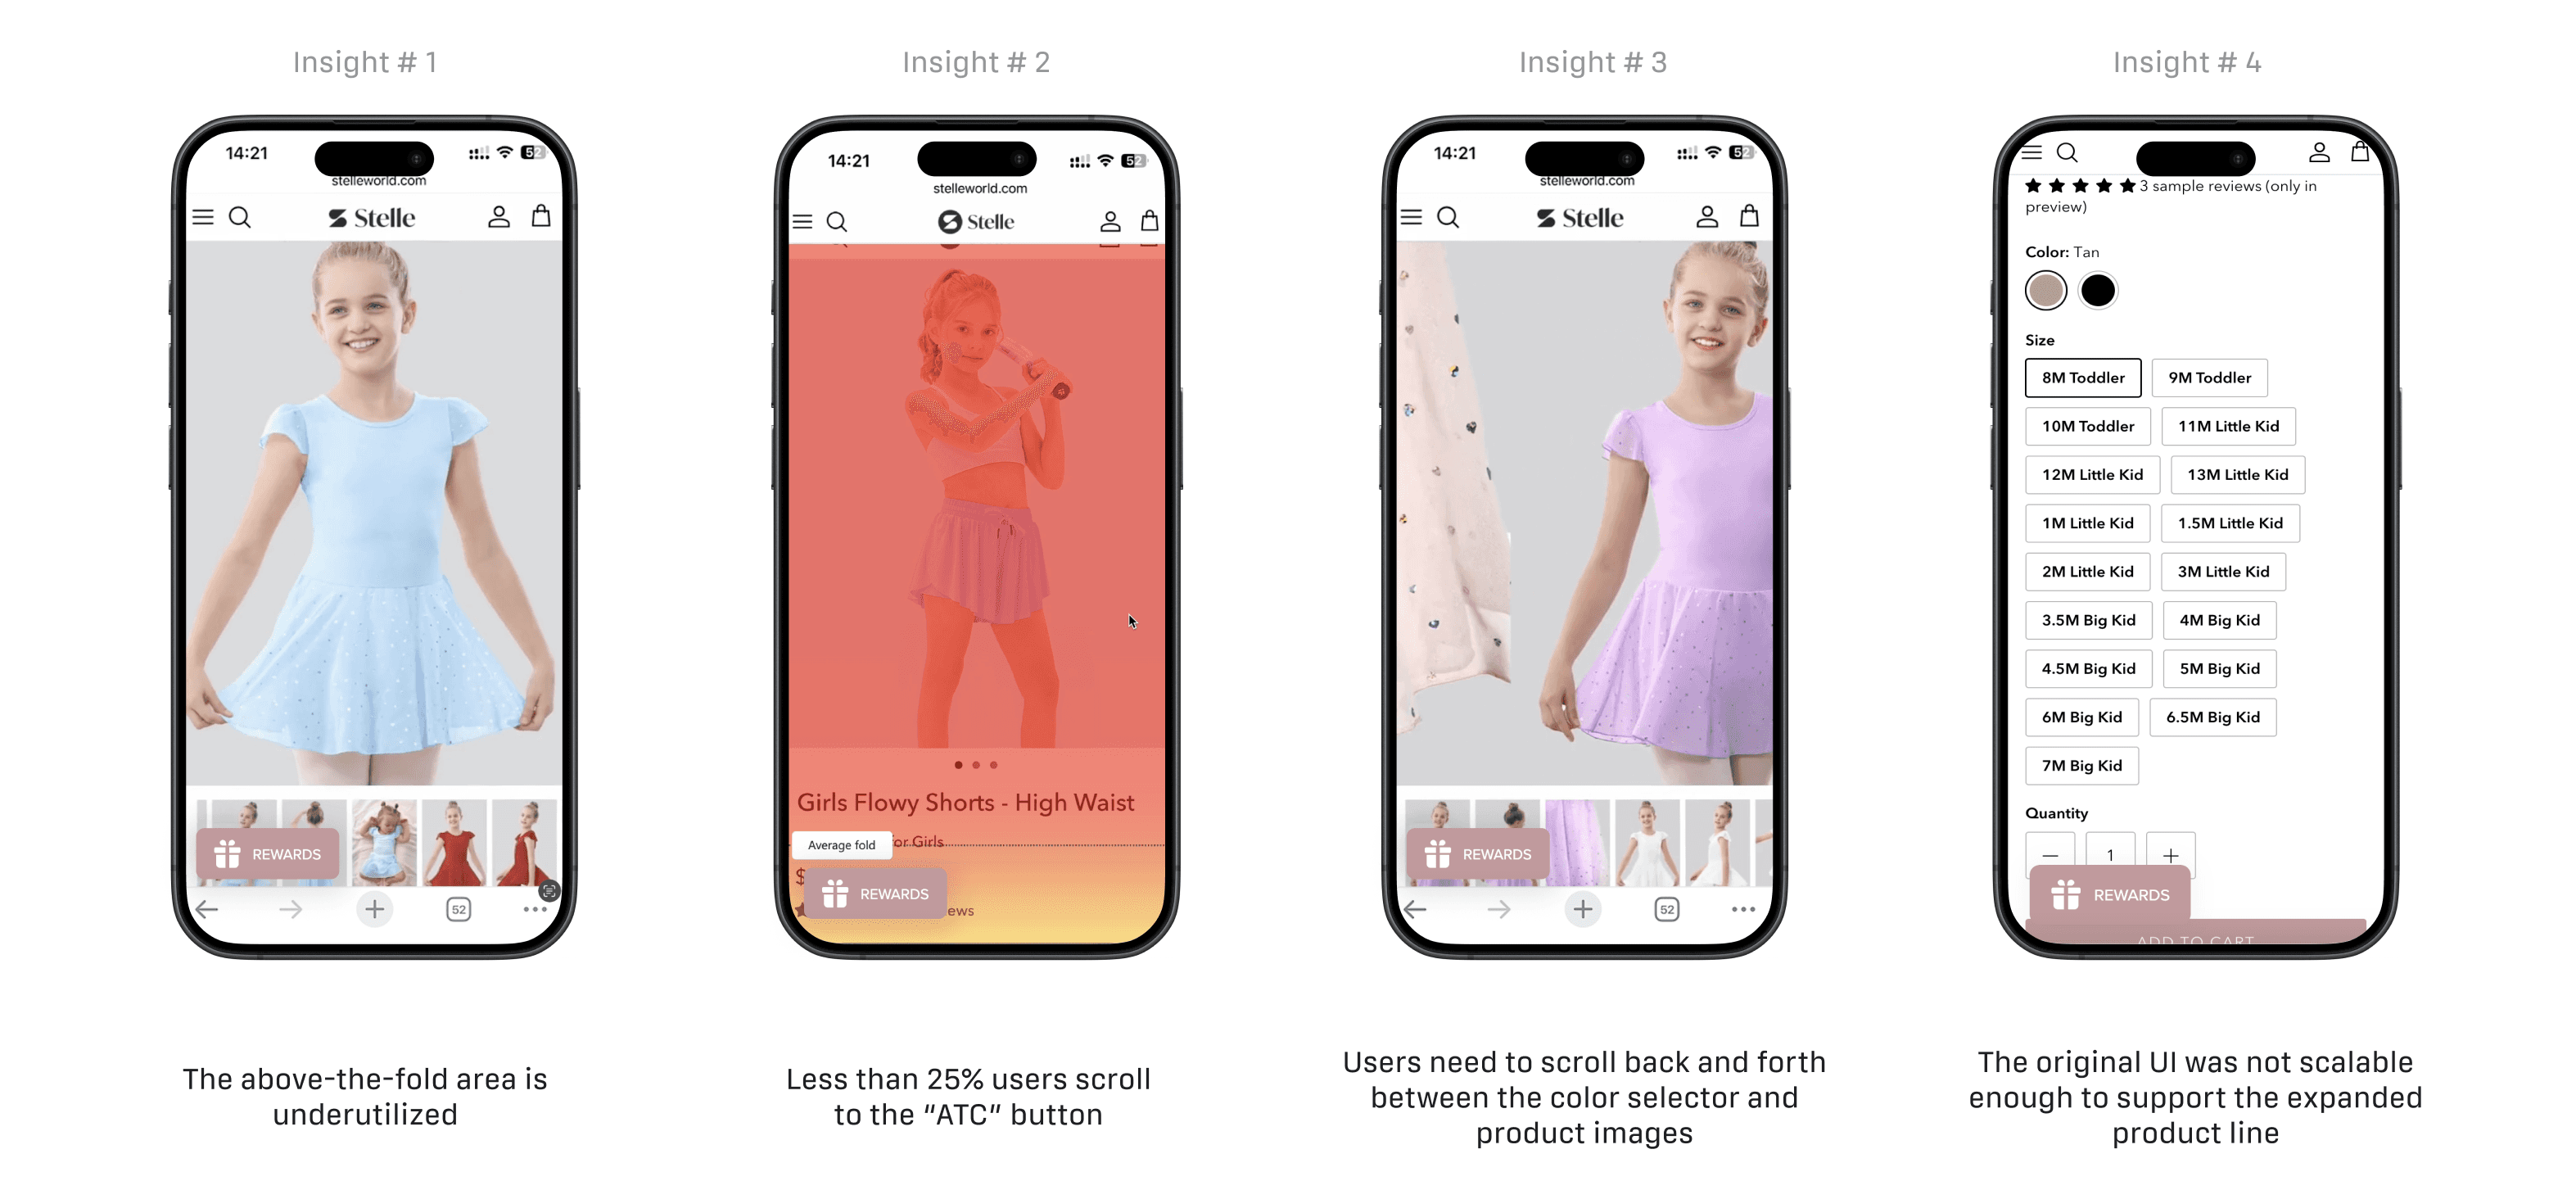
1. Optimized above-the-fold content to highlight what matters most to customers
2. Increase visibility of the CTA
(delayed-trigger, sticky bottom)
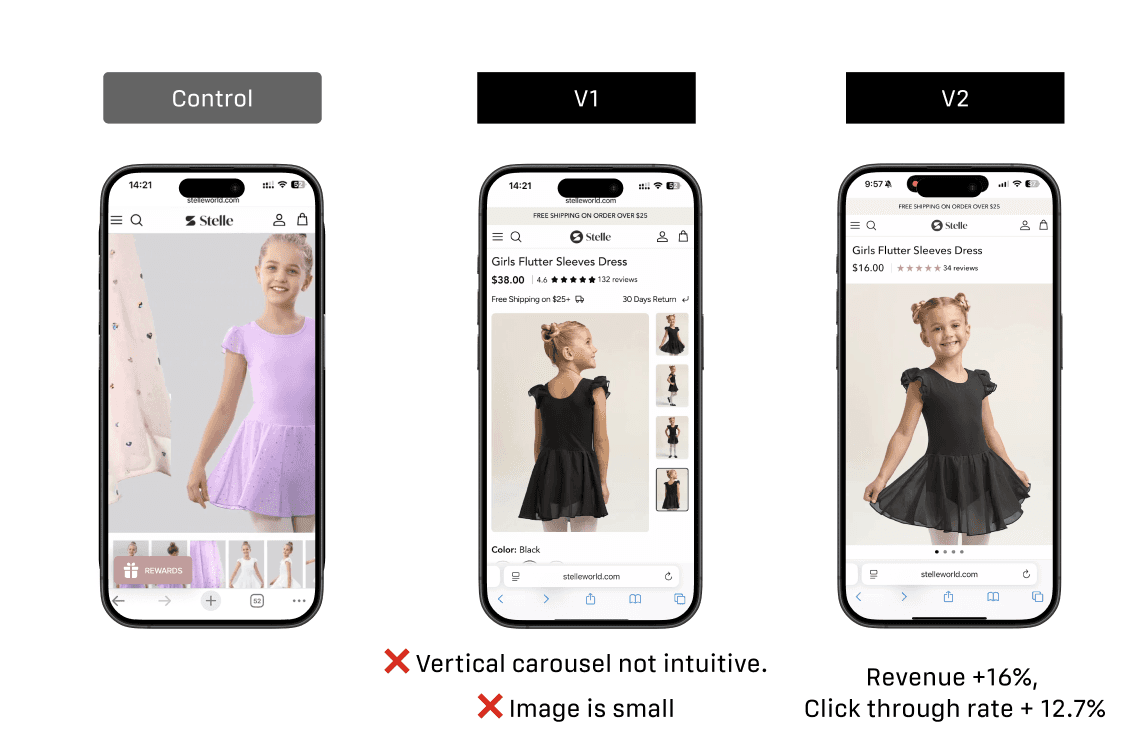
3. Fix the color-image usability problem
4. Add trust signals

1. Improve shoe sizing experience
2. Maintain brand and layout consistency
3. Tailor product imagery and context for different age groups
2024 Q3:
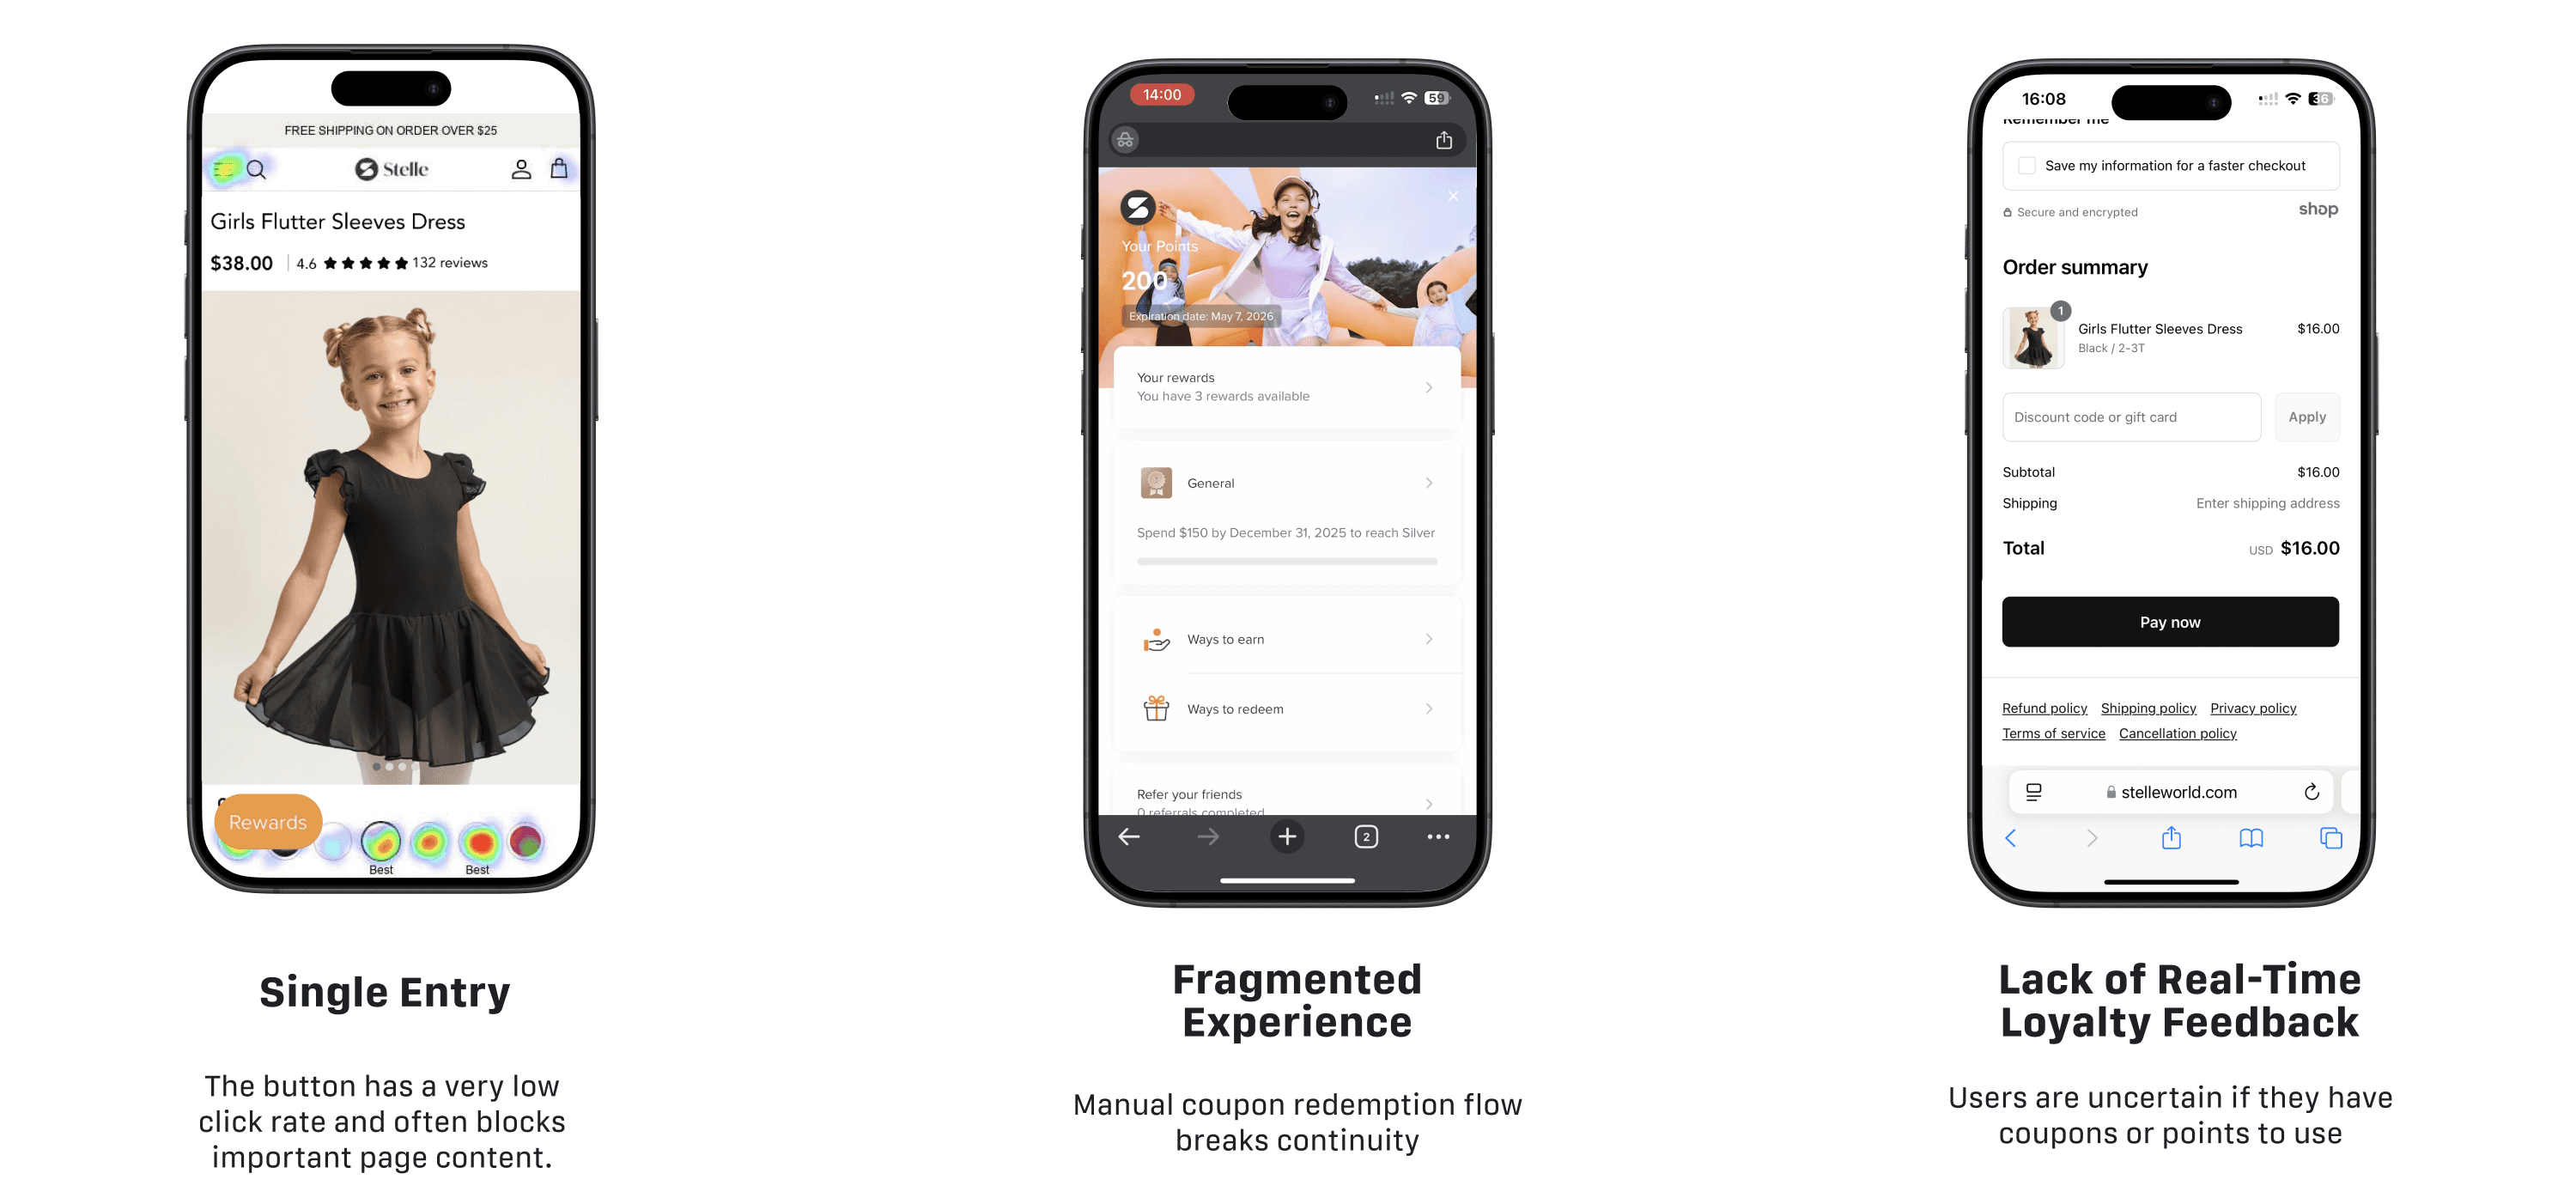
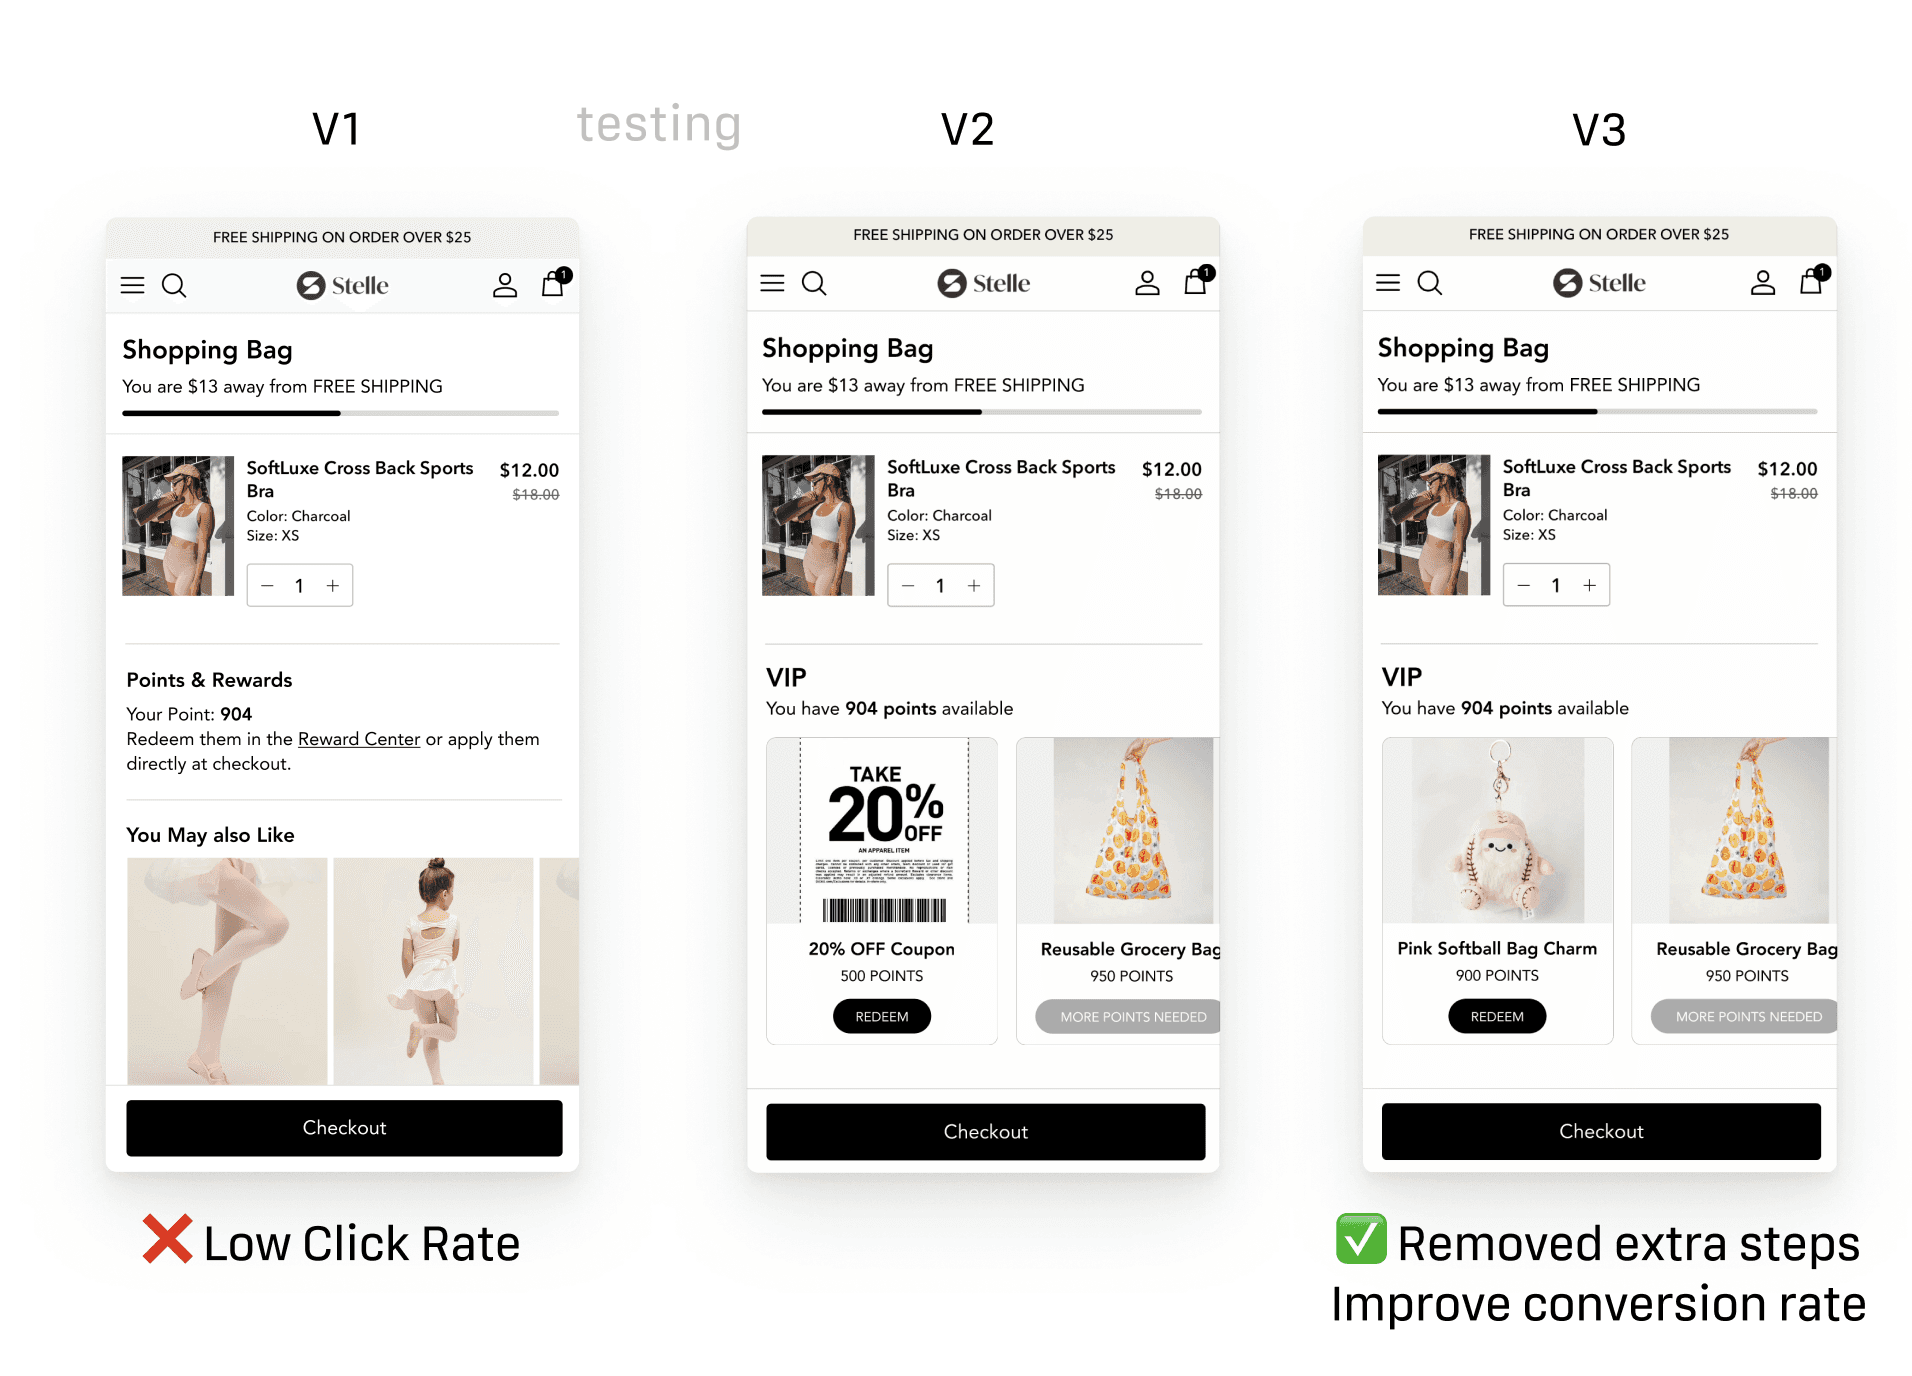
Customer Retention Enhancement
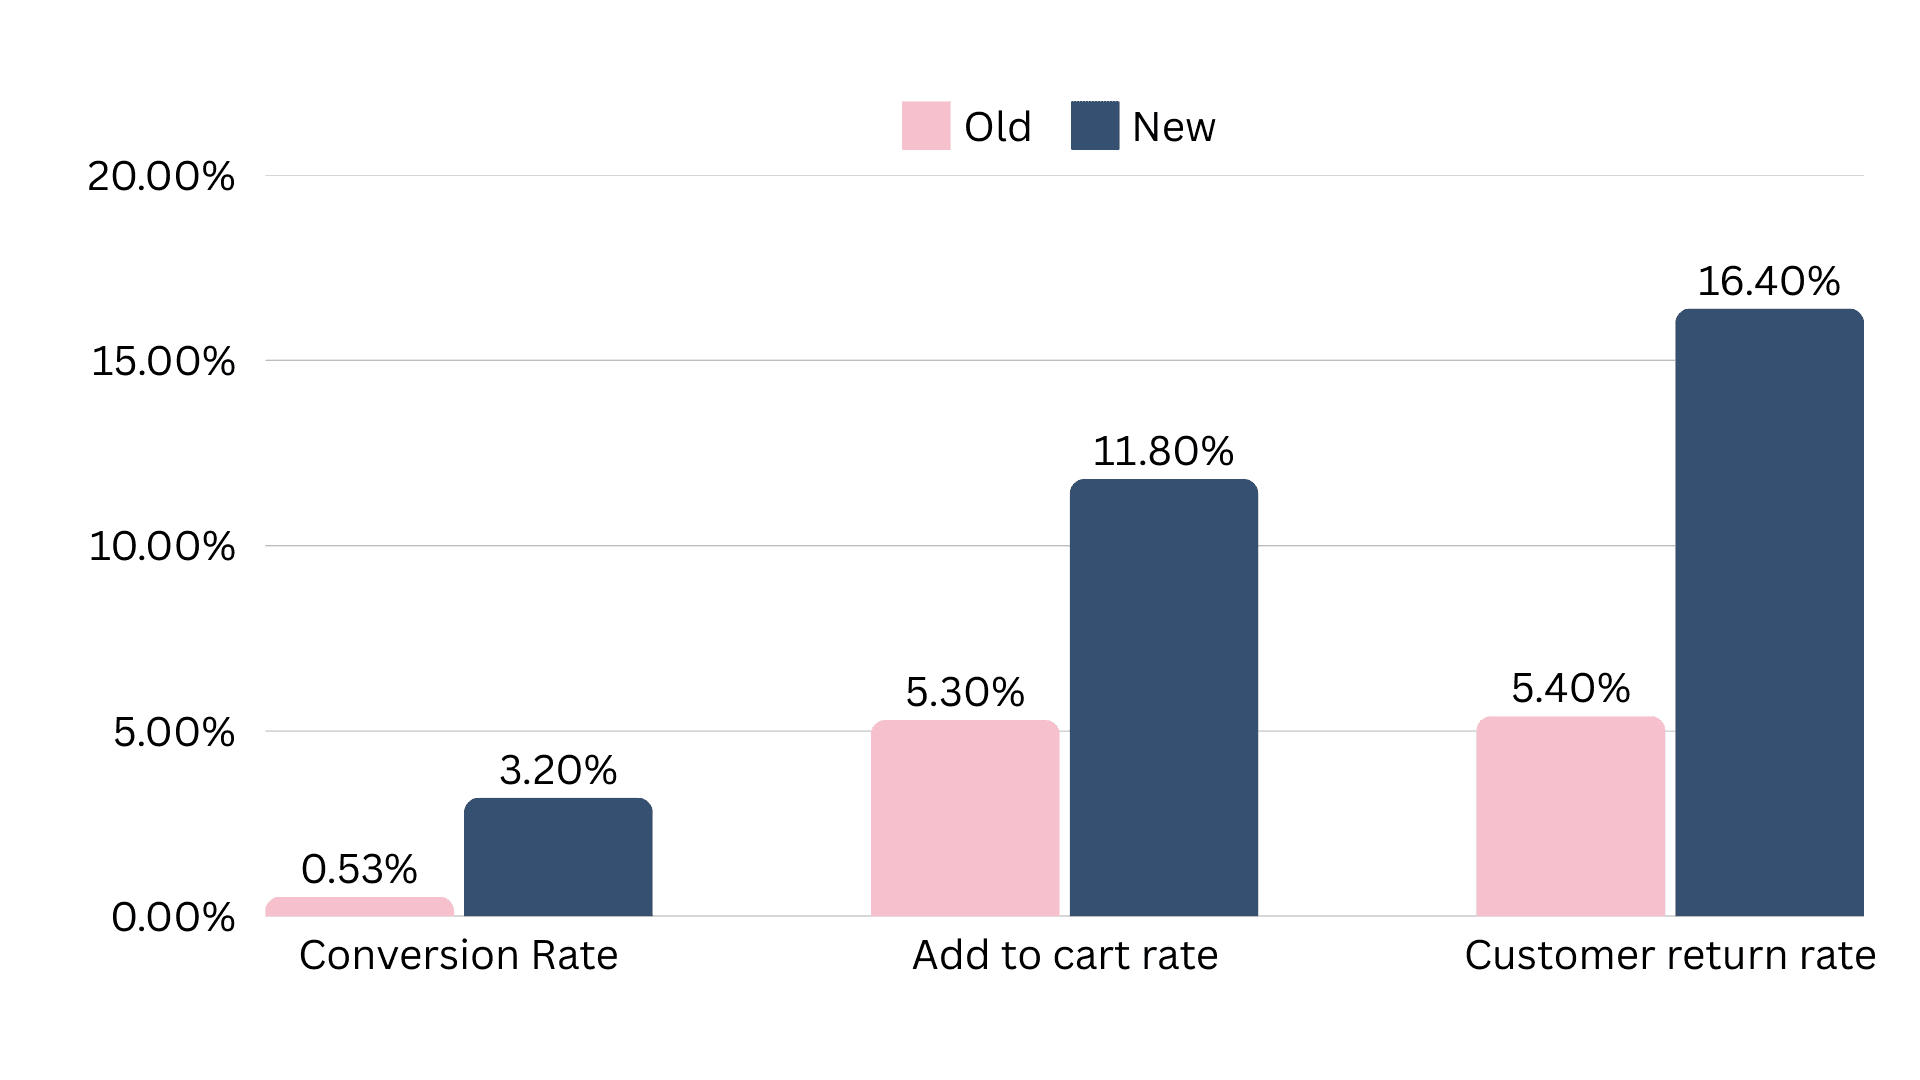
Data revealed key retention challenges: only 5.4% of customers placed more than one order, with an annual purchase frequency of 1.12 times and an average order value (AOV) of $35. To address this, I shifted our focus to two key metrics:

Responsive Design

Summary
Explore and shop with stelle at : https://stelleworld.com/